

Last reviewed November 18, 2026, against Morningstar, Social Security Administration, IRS and Medicare sources.
Most people ask "how much do I need to retire?" hoping for one number. There isn't a universal one, but there is a reliable way to estimate yours. It depends far more on what you will spend and what income you will have anyway, such as Social Security, than on your salary.
This guide gives you a simple formula, the 2026 inputs to use, a calculator, tables by spending level and retirement age, and a full worked example for a couple retiring at 62. It also covers retiring early, what Social Security's funding gap means for your plan, why illiquid wealth doesn't count the same way, and what to do if your number looks out of reach.
Retirement Number Calculator
Enter your own figures in today's dollars. The sections below explain each input.
The Retirement Number Formula
A useful first estimate of the savings you need is:
Retirement number = (annual spending − guaranteed income) ÷ withdrawal rate + bridge to Social Security + one-off costs
- Annual spending is what you expect to spend each year in retirement, in today's dollars, including income taxes and health insurance.
- Guaranteed income is income that doesn't depend on your portfolio: Social Security, pensions and lifetime annuities. Rental income is not guaranteed; include it only at a conservative level, after vacancies and repairs.
- The gap is the difference. It is what your savings must provide every year.
- The withdrawal rate turns the gap into a lump sum. At 4%, you need 25 times the gap; at 3.9%, about 25.6 times.
- The bridge covers the years between retiring and claiming Social Security, when your savings must also replace the benefit you haven't started yet.
- One-off costs are large planned expenses that your annual spending doesn't include, such as a second home, a wedding or lifetime gifts.
This is a transparent shortcut, not a full financial plan. It assumes withdrawals rise with inflation and holds the bridge in conservative assets that roughly keep pace with inflation. A year-by-year cash-flow plan, which accounts for actual claiming dates, taxes, investment returns and the death of a spouse, will refine it.
Step 1: Estimate What You Will Spend
Start from spending, not income. Rules such as "replace 80% of your income" are useful checks, but two households with the same salary can need very different amounts.
- Take your current annual spending from bank and card statements, not your budget.
- Remove costs that end at retirement: retirement-plan contributions, payroll taxes, commuting, a mortgage that will be paid off, and children's costs that will stop.
- Add costs that rise or begin: travel, hobbies, and health care before Medicare at 65.
- Add recurring irregular costs as a yearly reserve, such as replacing a car every eight to ten years or a roof every twenty, unless you already budget for them.
- Include income taxes on the money you will withdraw, and on Social Security: up to 85% of benefits can be federally taxable, depending on your other income.
Health care deserves its own line. Before 65, most retirees buy coverage through the ACA marketplace or COBRA. From 65, Medicare applies, though enrollment isn't always automatic if you haven't claimed Social Security. The standard Part B premium is $202.90 a month in 2026, rising to $209.40 in 2027. Higher-income retirees pay income-related surcharges (IRMAA) on Parts B and D. Long-term care is a large, uninsured risk for many households and is worth planning for separately.
How much you need by monthly spending
If you haven't estimated Social Security yet, this table shows the savings needed at a 3.9% withdrawal rate for different levels of spending and guaranteed income (before any bridge or one-off costs):
Step 2: Subtract Guaranteed Income
Social Security
Social Security is inflation-adjusted, lifelong income, which makes it one of the most valuable assets many retirees own. In January 2027, benefits rise 3.6%, and the average retired worker's benefit goes from about $2,095 to about $2,170 a month (Social Security Administration, October 2026). High earners who claim later receive much more.
Your claiming age changes the check:
Get your own estimate from your my Social Security account at ssa.gov. If you plan to stop working well before you claim, model an estimate that assumes no further earnings, because the standard estimate may assume you keep working.
Plan for the funding gap. The 2026 Social Security Trustees Report projects that the retirement trust fund (OASI) will be depleted in the fourth quarter of 2032. After that, incoming payroll taxes would cover about 78% of scheduled retirement benefits unless Congress changes the law. If the retirement and disability funds were combined, which would require legislation, depletion would come in 2034 with about 83% payable. Nobody knows what Congress will do, so a prudent plan tests a cut of about 22% and treats full benefits as upside.
Pensions, annuities and rental income
Add any pension (note whether it has a cost-of-living adjustment), income annuities you own, and rental income after expenses and vacancies. Be conservative with rent: it is less certain than a pension, and it comes with work and capital costs.
Step 3: Choose a Withdrawal Rate
The withdrawal rate is the share of your portfolio you take in the first year of retirement, increasing the dollar amount with inflation each year after. It is the most important assumption in your number.
The two lines of research are not directly comparable. Bengen's figure is the worst case from history; Morningstar's is a forward-looking estimate with a stated probability. Both point the same way: around 4% is a reasonable starting point for 30 years, and less for longer or less flexible retirements.
What moves the right rate for you:
- Length of retirement. Morningstar's 3.9% assumes 30 years. Many planners test to age 95 or later, especially for couples, because the odds that one spouse lives into their 90s are high.
- Flexibility. A defined willingness to cut spending in bad years supports a higher starting rate.
- Fees. Morningstar's base case excludes fees. Advisory and fund fees reduce the safe rate, though not always point for point, so model them explicitly.
- Taxes. The rate applies to gross withdrawals, so taxes must be inside your spending figure.
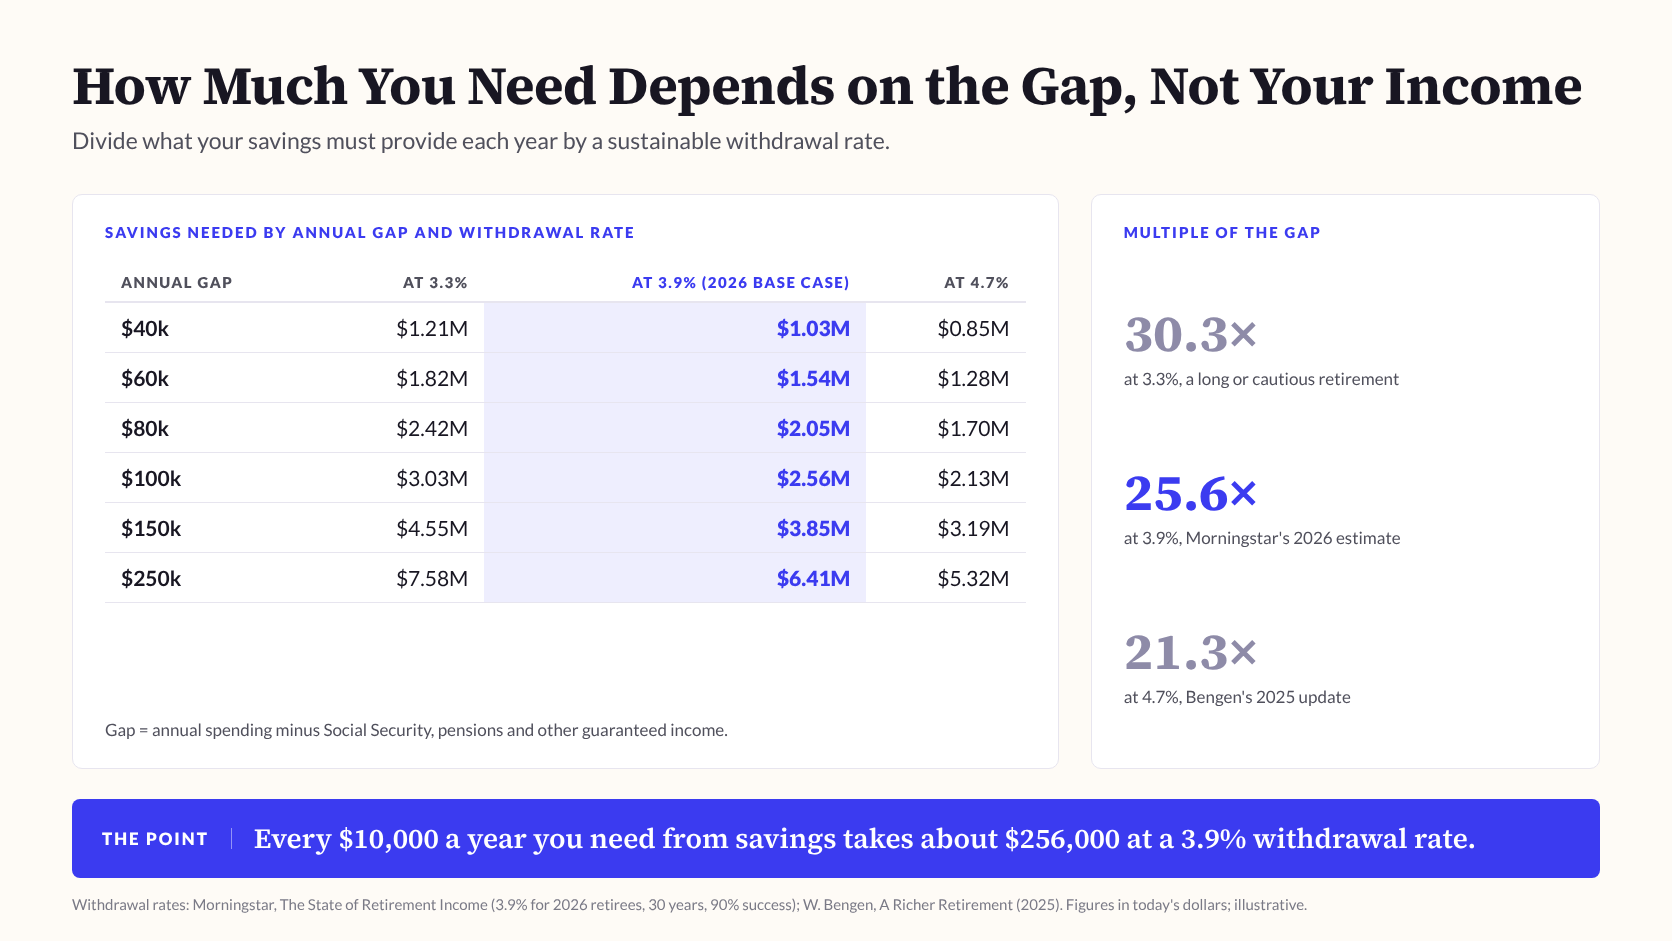
The rate converts into a multiple of the gap:
Every $10,000 a year you need from savings takes about $256,000 at a 3.9% withdrawal rate.
How Much You Need: Table by Income Gap
Find your gap (spending minus guaranteed income) and a withdrawal rate to read your core number, then add any bridge and one-off costs.
Read it the other way to test savings you already have. At 3.9%, $1 million supports about $39,000 a year on top of guaranteed income, $2 million about $78,000, $3 million about $117,000, and $5 million about $195,000. Our guide to whether $5 million is enough to retire works through the higher end.
Step 4: Add the Bridge and One-Off Costs
The bridge. If you retire before claiming Social Security, the core portfolio pays the gap from day one, and a separate bridge fund pays the part of your spending that Social Security will cover later. Size it as your expected annual benefit times the number of years until you claim, and hold it in conservative assets such as Treasuries, a CD ladder or short-term bonds.
One-off costs. List large planned expenses that aren't in your annual spending, at today's cost.
A reserve. Many planners add a cushion for health and long-term care late in life, or plan to use home equity for it.
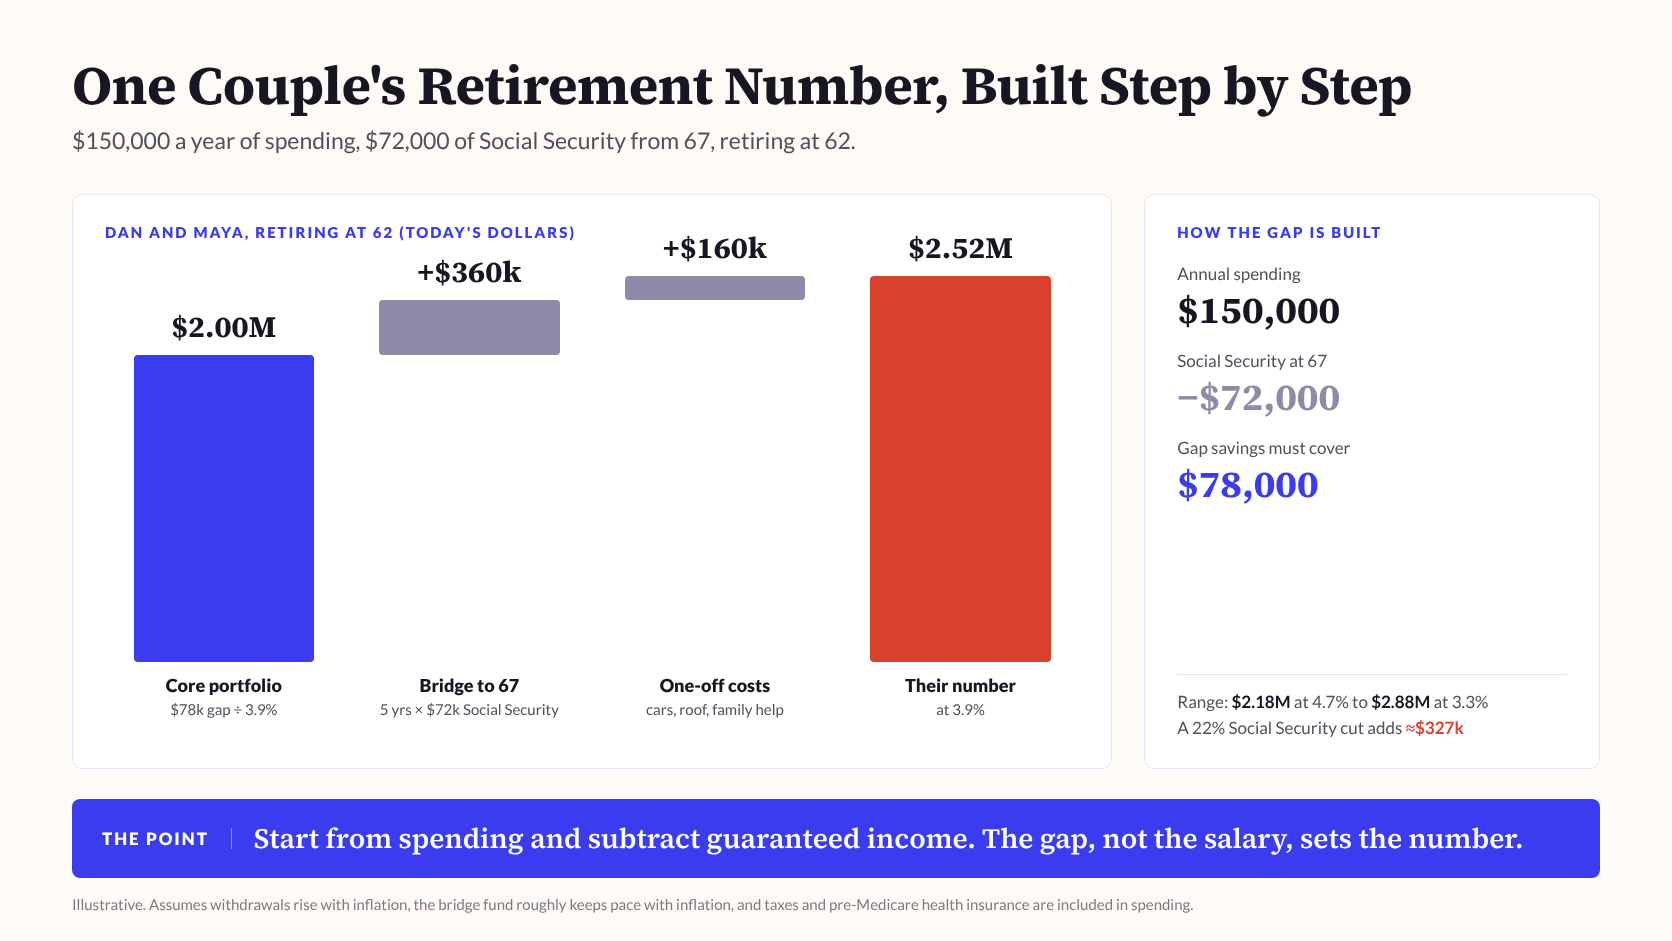
Worked Example: A Couple Retiring at 62
Dan and Maya are both 60 and want to retire at 62, with a plan that runs 30 years, to age 92. All figures are in today's dollars.
At Morningstar's 30-year rate of 3.9%, they need about $2.52 million of investable savings. Because one of them could well live past 92, they should also test a longer plan: at the 35-year rate of 3.5% (to age 97), the number rises to about $2.75 million.
Stress test: a Social Security cut. If their benefits were cut by 22%, in line with the Trustees' projected shortfall, Social Security would fall to about $56,160 a year. The gap rises to $93,840, so the core portfolio grows to about $2.41 million. Because that larger portfolio pays more of their spending from day one, the bridge only has to cover the reduced benefit, about $281,000. With the $160,000 of one-off costs, their number rises to about $2.85 million, an increase of about $327,000.
What if they delay Social Security to 70? Their benefits would be 24% higher for life, about $89,280 a year. After 70, their savings only need to cover $60,720 a year ($150,000 − $89,280), so the core portfolio falls to about $1.56 million. But from 62 to 70 that portfolio pays only $60,720 a year, so the bridge must cover the other $89,280 for eight years, about $714,000. With one-off costs, the total falls only to about $2.43 million. That is a funding allocation, not money they lose. The real case for delaying is longevity insurance: on simple cumulative payments, claiming at 70 overtakes claiming at 67 around age 82½, or about 84 to 86 if the money could otherwise earn 2%–3% a year after inflation. When the first spouse dies, the survivor generally keeps the larger of the two benefits, not both, which favors delay by the higher earner.
The model ignores investment returns on the bridge, taxes on Social Security that vary with income, and survivor spending. It is a planning estimate, not a recommendation.
How Much Do You Need to Retire at 50, 55, 60, 65 or 67?
Age changes two inputs: how long the money must last and how many years you must bridge before Social Security. Here is one household, spending $100,000 a year with $40,000 of Social Security from 67, planning to age 95:
Rates for 30, 35 and 40 years follow Morningstar's research; 3.0% for 45 years is our planning assumption, beyond the horizons Morningstar publishes. Social Security is held at $40,000 for comparison, although retiring early usually lowers it. Illustrative only.
Retiring at 50 takes about 74% more than retiring at 67 for the same lifestyle, and it brings two more problems to solve: health insurance until Medicare, and reaching retirement accounts before 59½ without the 10% penalty, through a Roth conversion ladder (converting pre-tax money to Roth and waiting five years) or 72(t) payments (a fixed series of equal annual withdrawals). Retiring early also lowers your Social Security, because fewer working years count toward it. Our guides to how to retire early and Coast FIRE cover those paths.
Retiring at 50 can take nearly three-quarters more savings than retiring at 67 for the same lifestyle.
Count Investable Assets, Not Net Worth
High-net-worth households often overestimate how close they are, because much of their wealth can't easily fund spending.
Take a household with a $5 million net worth: a $1.2 million home, a $1.8 million share of a private business, and $2 million in brokerage and retirement accounts. At 3.9%, the investable $2 million supports about $78,000 a year. The business and the home only help if they will be sold, downsized or borrowed against, and on what timeline.
When you run your number:
- Count only what can fund spending: brokerage, retirement accounts, cash, and assets you will actually sell.
- Treat a business sale as a plan, not an asset. Model the after-tax proceeds and the date, and test a lower price.
- Account for private fund commitments. Unfunded capital calls reduce what you can spend; distributions are irregular.
- Adjust for taxes by account type. $1 million in a traditional 401(k) is worth less after tax than $1 million in a Roth IRA. Account for those taxes either here or in your spending figure, not both.
- Decide on a legacy goal. If you want to leave a set amount to heirs, add it to your number rather than planning to spend down.
Rules of Thumb, and When They Mislead
Use these to sanity-check your result. If your spending-based number is far from all of them, recheck your inputs.
Taxes Change Your Number
Two households with the same savings can have very different spending power. $2 million all in a traditional 401(k) is worth less after tax than $2 million split across Roth, taxable and pre-tax accounts, because every pre-tax dollar withdrawn is taxed as ordinary income. Required minimum distributions from pre-tax accounts start at 73, or 75 for people born in 1960 or later, which can push retirees into higher brackets and Medicare surcharges. Roth IRAs have no required distributions during the owner's lifetime.
Ways to improve the after-tax number:
- Diversify by tax treatment so you can control taxable income each year.
- Use low-income years for Roth conversions, often between retirement and Social Security or RMDs.
- Place assets carefully: bonds generally in tax-deferred accounts, broad stock index funds in taxable accounts.
- Plan the withdrawal order across taxable, pre-tax and Roth accounts.
How Much Should You Save Each Month?
Work backward from the number. Suppose you are 50, have $1.2 million invested, and want $2.52 million by 62. If your savings earn 4% a year after inflation, today's $1.2 million grows to about $1.92 million by 62, leaving about $600,000 to save. That takes about $3,250 a month for 12 years at the same return.
The calculator above does this for your own inputs. Re-run it each year: markets, spending and your plans will change.
What If You Are Behind?
- Work a little longer. Each extra year adds savings and removes a year of withdrawals. More earnings can also raise your Social Security if they replace lower-earning years in your record.
- Delay Social Security. Waiting from 67 to 70 raises your benefit by 24% for life, and protects a surviving spouse if you are the higher earner.
- Use catch-up contributions. In 2026, savers 50 and older can put $32,500 into a 401(k), and those aged 60 to 63 up to $35,750. For 2027 the totals rise to $34,000 and $37,250. If your prior-year FICA wages from the employer sponsoring the plan were over $150,000 (for 2026 catch-ups) or $155,000 (for 2027), your catch-ups must go in as Roth contributions, and if the plan has no Roth option you can't make them.
- Adopt a defined flexible spending rule. Agreeing in advance how much you will cut after a bad year supports a higher starting withdrawal rate.
- Earn a little in early retirement. $20,000 a year of consulting or part-time income offsets $20,000 a year of withdrawals while it lasts, which matters most in the first years, when a market fall does the most damage.
- Reduce fixed costs. Downsizing or relocating can cut spending and taxes. Our guide to geographic arbitrage covers moving somewhere cheaper.
Tracking Your Retirement Number in Kubera
A retirement number only helps if you know where you stand against it, which is hard when savings sit in 401(k)s, IRAs, brokerage accounts, real estate and private investments across several institutions. Kubera brings them onto one balance sheet.
- See your investable total. Connect retirement and brokerage accounts, add real estate, private investments and other assets manually, and separate what is investable from what is not.
- Model scenarios with Fast Forward. Test a retirement date, a Social Security start, spending changes, one-off costs and different returns, and see how your projected net worth changes. It is scenario modeling, not a probability-of-success simulation; see how it compares with traditional retirement calculators.
- Measure actual returns. Once cash flows are recorded, Kubera calculates IRR, so the return you assume can be checked against the one you get.
- Organize by person and tax treatment. On Kubera Black, nested portfolios group each spouse's pre-tax, Roth and taxable accounts, which helps with withdrawal and conversion planning.
- Keep documents with the numbers. Use AI Import to bring in statements, and store Social Security and pension estimates alongside the accounts they relate to.
Try it with a 14-day free trial.

Conclusion
To answer "how much do I need to retire," start with what you will spend, subtract the income you will have anyway, and divide the gap by a withdrawal rate that fits the length of your retirement. Then add a bridge to Social Security and your one-off costs. Count only the assets that can actually fund spending.
Use 3.9% as a reasonable 2026 starting point for a 30-year retirement and lower rates for longer ones. Test your plan against a Social Security cut and a weak first few years in the market. Then update the number every year.
Frequently Asked Questions
How much do I need to retire comfortably?
Enough that your savings can cover the gap between your spending and your guaranteed income at a sustainable withdrawal rate, plus any bridge and one-off costs. For example, a $60,000 gap needs about $1.54 million at 3.9%.
How much do I need to retire at 60?
For a household spending $100,000 a year with $40,000 of Social Security from 67, about $2.0 million for a 35-year retirement at a 3.5% withdrawal rate, including a seven-year bridge to Social Security.
Is $1 million enough to retire?
At 3.9%, $1 million supports about $39,000 a year of inflation-adjusted spending on top of Social Security and pensions. A retiree spending about $79,000 with $40,000 of Social Security could manage on that; someone spending more would need more savings or more income.
What is the 4% rule?
A rule of thumb from William Bengen's 1994 research: withdraw 4% of your portfolio in year one and raise the dollar amount with inflation each year, and your money should last at least 30 years. Bengen raised his figure to 4.7% in 2025 for a more diversified portfolio, while Morningstar's forward-looking estimate for 2026 retirees is 3.9%.
How much should I save each month to retire?
Subtract what your current savings will grow to by your retirement date from your target, then spread the rest over the years you have left. At a 4% real return, closing a $600,000 gap over 12 years takes about $3,250 a month.
Should I count my home or business in my retirement number?
Only if you plan to sell, downsize or borrow against them. Count assets that can produce income or be sold to fund spending, and treat a business sale as a dated, after-tax plan.
What happens to Social Security when my spouse dies?
The surviving spouse generally keeps the larger of the two benefits and loses the smaller one. Plan for lower household income after the first death, offset partly by lower spending.
Will Social Security still be there when I retire?
Benefits will continue, but the 2026 Trustees Report projects the retirement trust fund will be depleted in late 2032, after which about 78% of scheduled retirement benefits would be payable without changes in the law. Plan with a cut and treat full benefits as upside.
Disclaimer
This article is general information as of November 18, 2026 and is not financial, investment or tax advice. Withdrawal rates, Social Security rules and tax laws change, and the examples use simplified, illustrative assumptions. Your retirement number depends on your circumstances. Consider working with a qualified financial planner before making retirement decisions.


