

Ask most investors how their portfolio is doing and they will tell you what the S&P 500 did. It is the wrong comparison for almost everyone who has more than a brokerage account, because the S&P 500 does not own a house, does not hold six months of cash for a roof, and never had a fund call capital in March. A useful benchmark answers a question you actually have, and there are two of them: is each thing I own earning what it should, and for someone with roughly what I have, are my numbers normal?
This guide covers why the headline return on a position is close to meaningless, how to benchmark each holding against the index on your own cash-flow dates, what a peer benchmark is and how Kubera builds one from anonymous customer data, the four peer numbers worth checking, what to do with a number that is off, and the mistakes that turn a benchmark into a bad decision.
Benchmarking Against Similar Investors at a Glance
- There are two benchmarks, not one. Against the market tells you whether a position beat what an index fund would have done with the same money on the same dates. Against people like you tells you whether your growth rate, invested share, cash and home are typical for your net worth band.
- The only fair market comparison is IRR on your own cash flows: the index's return if it had received your exact deposits and withdrawals on your exact dates. Kubera calculates this per position and shows it next to the S&P 500 or any ticker you choose (help centre).
- Active management is a hard benchmark to beat: 79% of active large-cap US equity funds underperformed the S&P 500 in 2025, up from 65% in 2024 (SPIVA, via InvestmentNews). Your own stock picks face the same bar.
- A peer benchmark compares you with a cohort, not an index. Kubera's Your Club puts you in an anonymous group of customers in a similar net worth range and shows your numbers next to the group's medians for net worth growth, investable assets, cash on hand and primary residence. Medians appear only once a club has 500+ members; individual data is never shared (help centre).
- A median is a reference point, not a target. The right response to an outlier is a question about why, not a transfer. Both benchmarks live in the Kubera portfolio tracker.
The two benchmarks, shown on a real balance sheet in two minutes:
Why the S&P 500 Is the Wrong Benchmark for a Whole Balance Sheet
An index benchmark works for one thing: a liquid, all-equity, fully invested portfolio with no cash flows. The moment a real balance sheet enters the picture, the comparison breaks in three places.
First, composition. A household with a home, a mortgage, a 401(k), a fund commitment and a cash reserve is not an equity portfolio, and comparing its net worth growth with an equity index measures asset mix, not skill. Second, cash flows. Money goes in and out on dates that have nothing to do with the calendar year the index is quoted for, and timing changes the answer more than most people expect. Third, purpose. The cash reserve exists so you never sell equities at the bottom; judging it against equities punishes it for doing its job.
So the question splits. For any single investment, the market benchmark is right, provided it is done on your cash flows. For the balance sheet as a whole, the better reference is other households like yours.
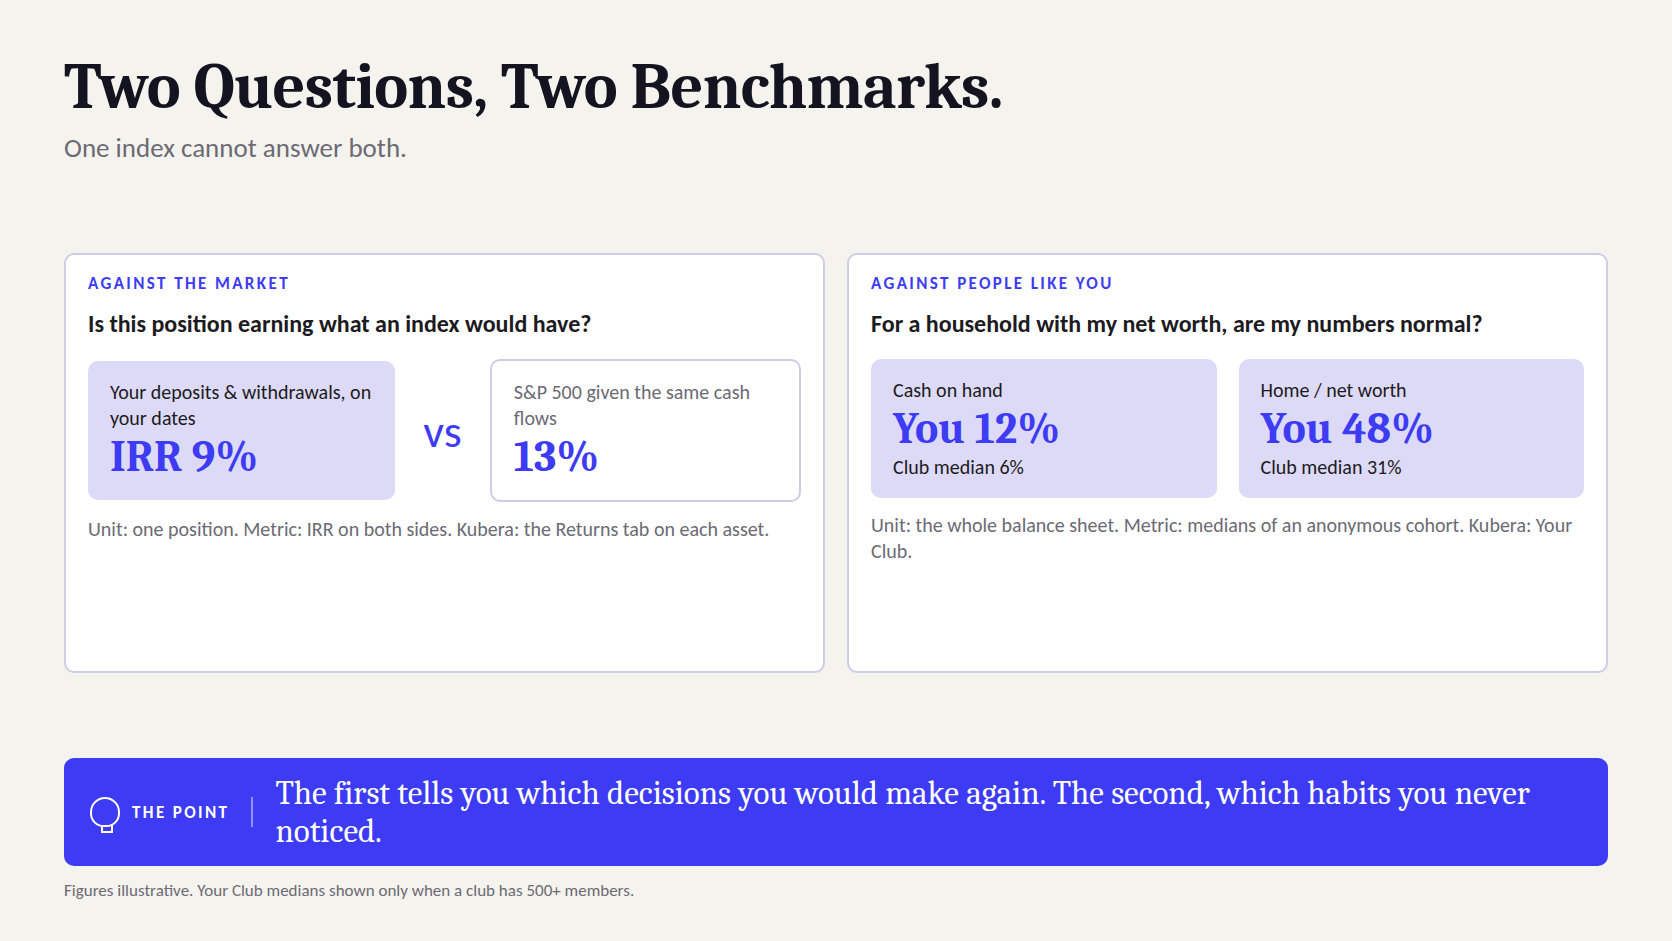
The two benchmarks and what each one answers
| Against the market | Against people like you | |
|---|---|---|
| The question | Is this position earning what an index fund would have earned with the same money on the same dates? | For someone with roughly my net worth, is my growth rate, cash level, invested share and home size normal? |
| Unit compared | One position or one account | The whole balance sheet |
| Comparison set | An index or a ticker (S&P 500, a total-market fund, a single stock, Bitcoin) | An anonymous cohort of investors in a similar net worth range |
| The right metric | IRR on your actual cash flows, for both sides | Medians for the cohort, your number beside them |
| What it catches | Decisions that did not beat doing nothing in an index fund | Concentration, excess cash, an oversized home, growth well behind peers |
| What it cannot tell you | Whether your overall mix is sensible | Whether any single investment is good |
Against the Market: Why "Up 30%" Means Nothing Without Dates
A brokerage screen says a position is up 30%. That number is the gain over cost, and it ignores the one thing that determines whether 30% is good: when the money went in. Thirty percent on a lump sum bought six years ago is a poor result. Thirty percent on money that mostly arrived last spring is an excellent one. The same figure, opposite verdicts.
The internal rate of return fixes this. IRR is the single annual rate that reconciles every deposit and every withdrawal, on the dates they happened, with the value today. It is the return you actually experienced, and it is the only per-position figure that can be compared fairly with an index, because the index can be given the same cash flows.
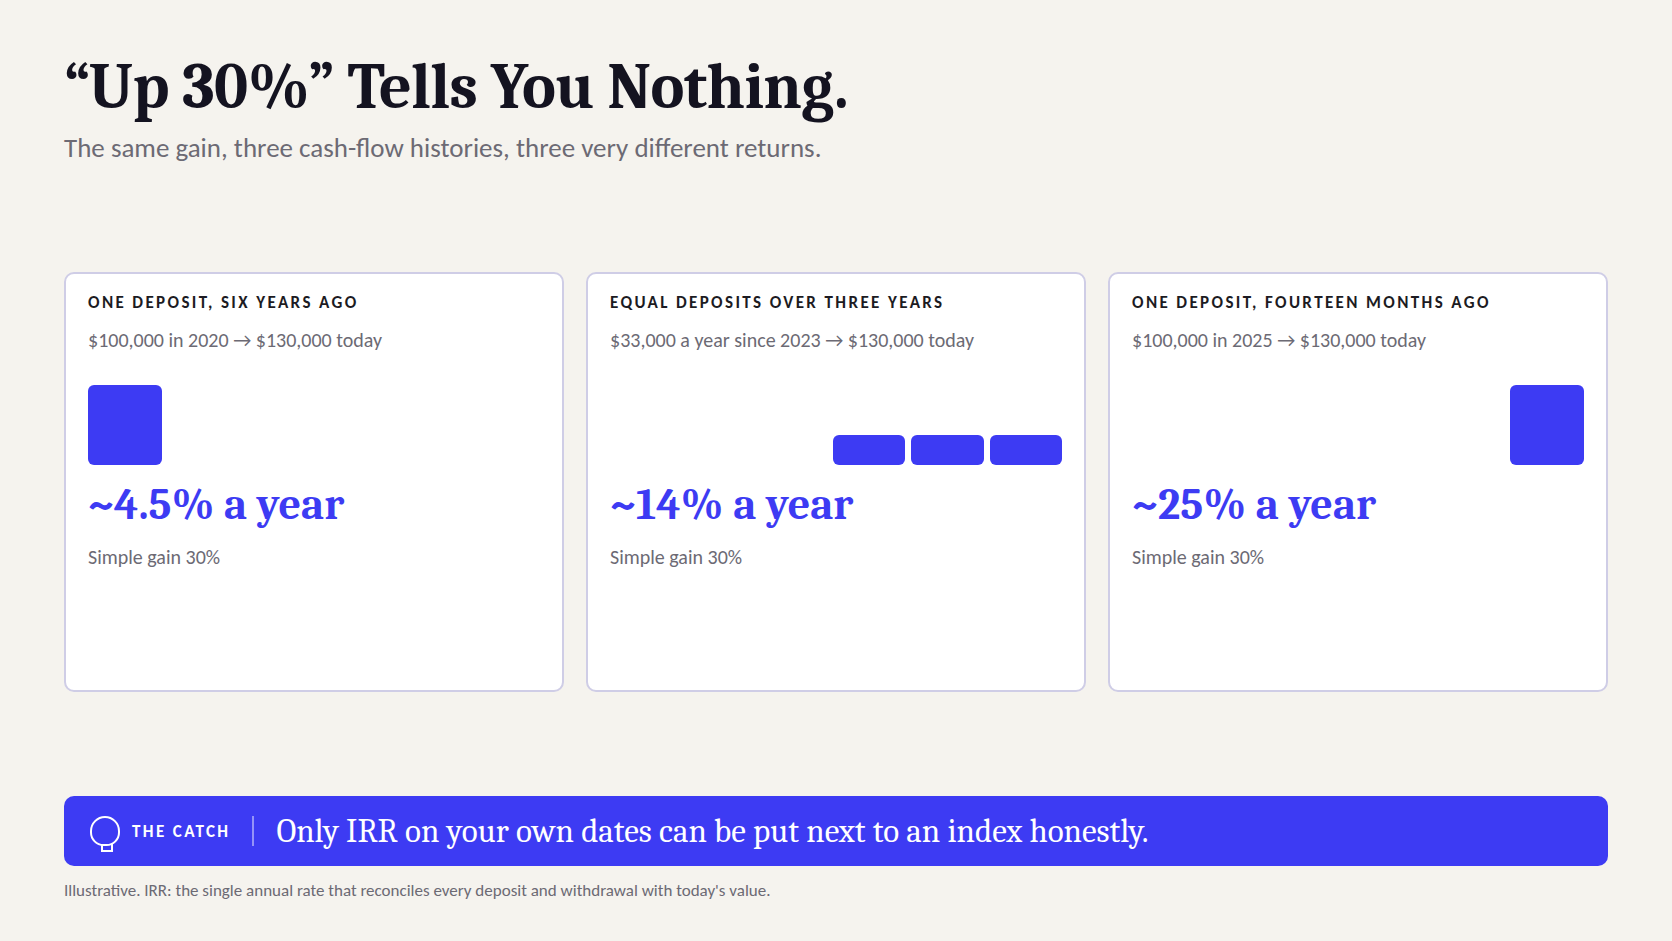
The same 30% gain, three cash-flow histories (illustrative)
| Cash-flow history | Money in | Value today | Simple gain | Approximate IRR |
|---|---|---|---|---|
| One deposit of $100,000 six years ago | $100,000 | $130,000 | 30% | About 4.5% a year |
| $100,000 in equal deposits over the last three years | $100,000 | $130,000 | 30% | Roughly 14% a year |
| $100,000 deposited fourteen months ago | $100,000 | $130,000 | 30% | Roughly 25% a year |
The third column is what most people look at. The last column is what matters, and it is also the only one you can put next to an index honestly: give the S&P 500 the same $100,000 on the same dates, and compare.
How to do it in Kubera
Every asset in Kubera has a Returns tab. You record the cash you put in and the cash you took out, with dates, and past brokerage transactions can be imported rather than typed (help centre). Kubera calculates the IRR from those flows, and beneath it shows what the S&P 500, or any ticker you pick, would have returned had it received the same deposits and withdrawals on the same dates. Change the ticker to a total-market fund, to a single stock, to Bitcoin, and the comparison recalculates for the same period (help centre).
Run this for the four or five positions that make up most of your money. It is the most useful hour an investor can spend, because it answers a question almost nobody has ever answered about themselves: which of my decisions beat simply buying the index, and which did not. The honest result is usually a mix, and the point is to know.
A worked example
A reader holds a technology stock she bought in three tranches: $40,000 in early 2021, $30,000 in mid-2022 after it fell, and $30,000 in 2024. The brokerage shows the position at $145,000, a 45% gain. Her IRR on those dates works out to roughly 9% a year. The S&P 500, given the same three deposits on the same three dates, would have compounded at roughly 13% a year over the same period.
The position made money. It also lost to the index, and the 2022 tranche, the one that felt like the smart contrarian buy, is the reason. None of that is visible in "up 45%".
Figures are illustrative; the method is the point.
The Bar Is Higher Than It Looks
It is worth knowing how hard the index is to beat before reading your own results. In S&P Dow Jones Indices' year-end 2025 SPIVA scorecard, 79% of active large-cap US equity funds underperformed the S&P 500 for the year, up from 65% in 2024 (InvestmentNews). Those are professionals with research teams, and their record over longer horizons is worse, not better. A private investor who finds two of their five main positions ahead of the index on a cash-flow basis is doing well; one who finds all five ahead should check the dates.
A benchmark is not there to make you feel good or bad. It is there to tell you which of your decisions you would make again.
Against People Like You: What a Peer Benchmark Is
The second question cannot be answered by any index: for a household with roughly my net worth, are my numbers typical? Until recently there was no way to know. Surveys such as the Federal Reserve's Survey of Consumer Finances give national medians by age or income, which is useful for a first look at where you stand but says nothing about how households with your net worth actually run their balance sheets.
A peer benchmark compares you with a cohort of similar investors on a few structural ratios: how fast net worth is growing, how much of it is invested rather than parked, how much cash is held, how large the home is as a share of everything. None of these is a return on a single investment. Each is a decision you have made, often without noticing, about how your wealth is arranged.
How Your Club works in Kubera
Kubera assigns every customer to a private peer group based on net worth range, described in the help centre as "an anonymous club of Kubera customers with net worth similar to yours". You do not join it, choose it or see who is in it. What you see is your own figure next to the club's median, for four measures. Medians are shown only when a club has 500 or more members, so no figure can be traced to a person, and only aggregated medians are ever displayed; your individual data is never shared. The club updates as your net worth changes, so a household that grows into the next band is compared with the next band (help centre).
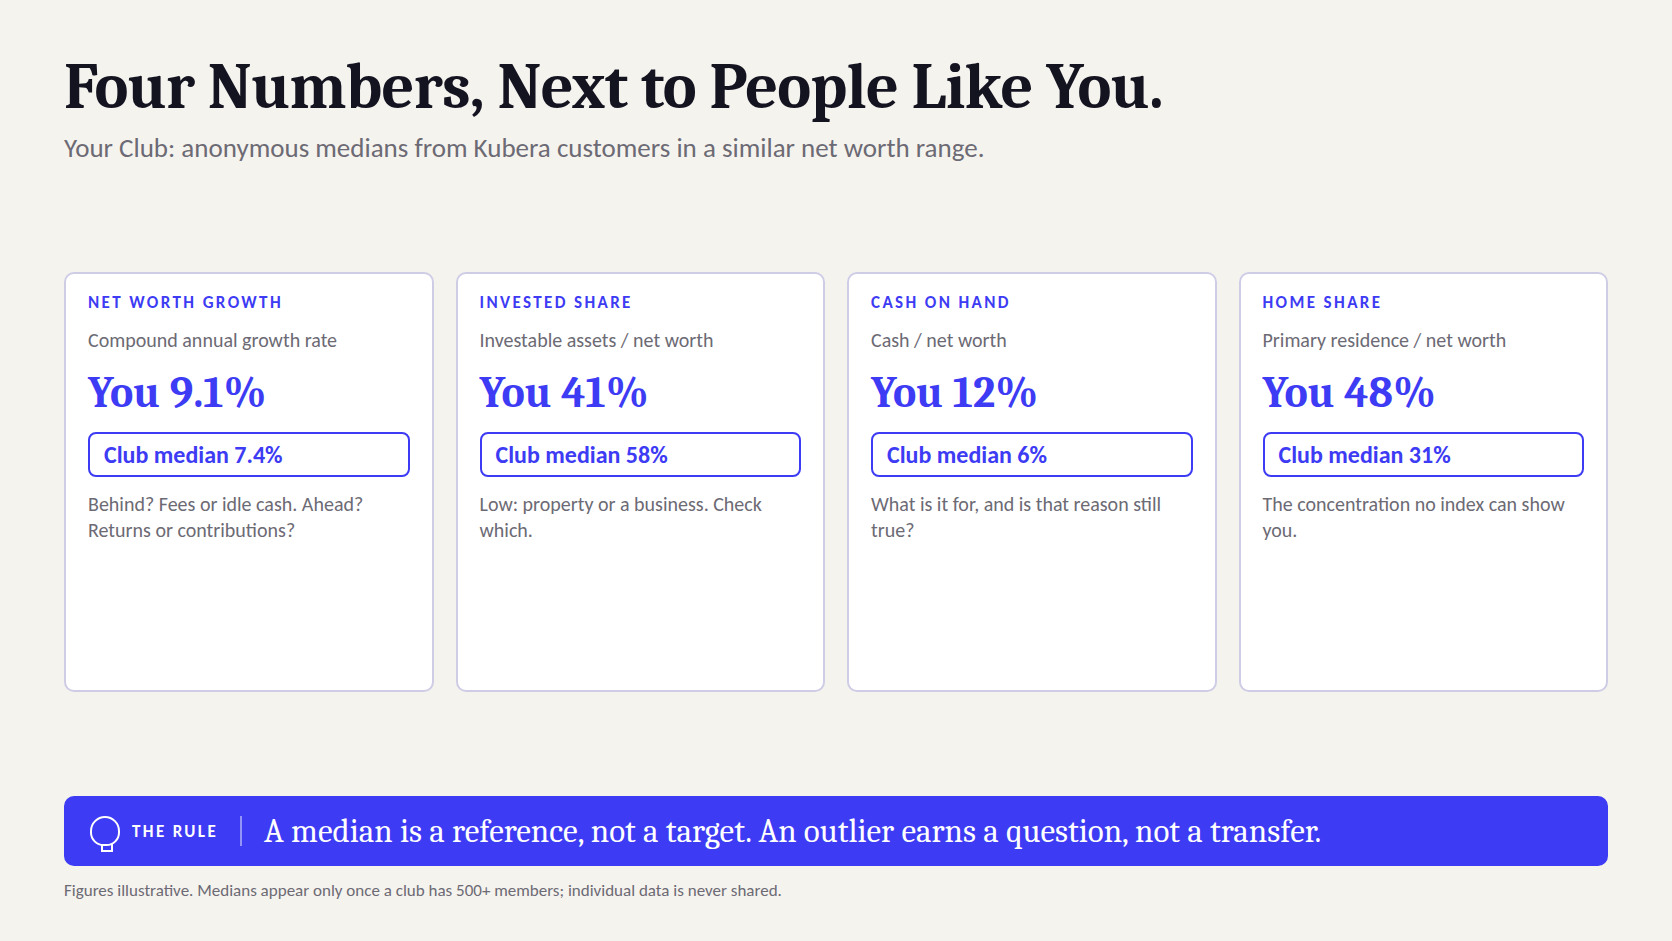
The four Your Club benchmarks and what each tells you
| Benchmark | What it measures | What an outlier usually means | Where it shows in Kubera |
|---|---|---|---|
| Net worth and investable-asset CAGR | Compound annual growth of your net worth and of your investable assets, against the club median | Behind: high fees, too much idle cash, or a large non-earning asset. Ahead: check whether it is returns or contributions | Dashboard, under Investable Assets |
| Investable assets as a share of net worth | How much of your wealth is in cash and assets that convert easily to cash (stocks, funds, bonds, crypto, retirement accounts), as opposed to the home, vehicles and other physical assets (help centre) | Low: wealth concentrated in property or a business. High: little tied up in real assets | Dashboard, under Investable Assets |
| Cash on hand | Cash and equivalents held, against the club median | High: a business owner's float, a pending purchase or capital call, or simply drift. Low: thin reserves | Dashboard, under Cash on Hand |
| Primary residence as a share of net worth | The home's value relative to total net worth | High: house-rich, cash-poor; a concentration an index comparison never shows | Assets > the home > Home details |
Two of these are worth singling out. Cash on hand is the number households most consistently misjudge; a reserve that felt prudent at one net worth is often twice what peers hold a few years later, quietly costing a percentage point of growth a year. And the home ratio is the concentration nobody benchmarks, because no index contains a house. Seeing that the primary residence is 55% of net worth when the club median is 30% is the kind of fact that changes a decision about the next property, or about whether to pay down the mortgage.
What People Like You Actually Hold
A related but different question is what similar investors own. Kubera's Billboard ranks the stocks, funds, cryptocurrencies, banks, brokerages and exchanges most held by paying US customers, updated monthly. The ranking is a count of how many customers hold each item, scored relative to the most-held one, and it is explicitly not a performance measure: the top of the list is what the most people own, not what did best (help centre). It is useful the way a walk through a car park is useful. You learn what people like you actually drive, not what the advertising says they should, and it is found under the profile picture in the desktop app.
What to Do With a Number That Is Off
This is where benchmarking goes wrong for most people. A median is a description of a group, and a group can be wrong together; the point of a peer benchmark is to make a decision conscious, not to replace it. A workable rule: an outlier earns a question, and the question earns an answer before any money moves.
A response framework for outliers
| Reading | The question to ask first | Reasonable outcomes |
|---|---|---|
| A position trails the index over five or more years on a cash-flow basis | Would I buy this today at this price, knowing what I know? | Keep it with a written reason; trim to a size you can defend; or exit and index the proceeds |
| Cash is well above the club median | What is this cash for, and is that reason still true? | Keep it, with a named purpose and date; or move the surplus to a plan |
| Invested share is well below the median | Is the shortfall property, a business, or simply cash? | Property or a business: a deliberate choice to revisit yearly. Cash: see above |
| Home is a much larger share than the median | Am I comfortable with this much of my wealth in one illiquid asset in one place? | Often yes; the decision is about the next purchase and the mortgage, not about selling |
| Net worth growth is behind the median | Is it returns, contributions, or a large non-earning asset? | Fees and idle cash are the usual culprits and both are fixable; a recent home purchase is not a problem |
Notice that most outcomes are "keep it, on purpose". That is the benchmark working. The failure mode is not ignoring the number; it is treating the median as an instruction and rebalancing a considered position into the group average.
The Mistakes That Turn a Benchmark Into a Bad Decision
- Comparing simple gain with an index's annual return. Different units. Only IRR against IRR, on the same dates, is a comparison.
- Benchmarking the whole balance sheet against equities. This measures asset mix, and the mix was chosen for reasons the index does not know about.
- Using the wrong ticker. A small-cap value fund against the S&P 500 is a style comparison, not a skill comparison. Pick the index the position was meant to beat.
- Reading a one-year number. One year of outperformance is noise. Five years on a cash-flow basis is evidence.
- Chasing the median. Peers with the same net worth do not share your income, obligations, tax position or plans. Their median is a reference, not a recommendation.
- Benchmarking what you cannot value. A private position with a stale mark will show a flattering IRR until the next round. Benchmark it on distributions, or wait.
How Kubera Fits
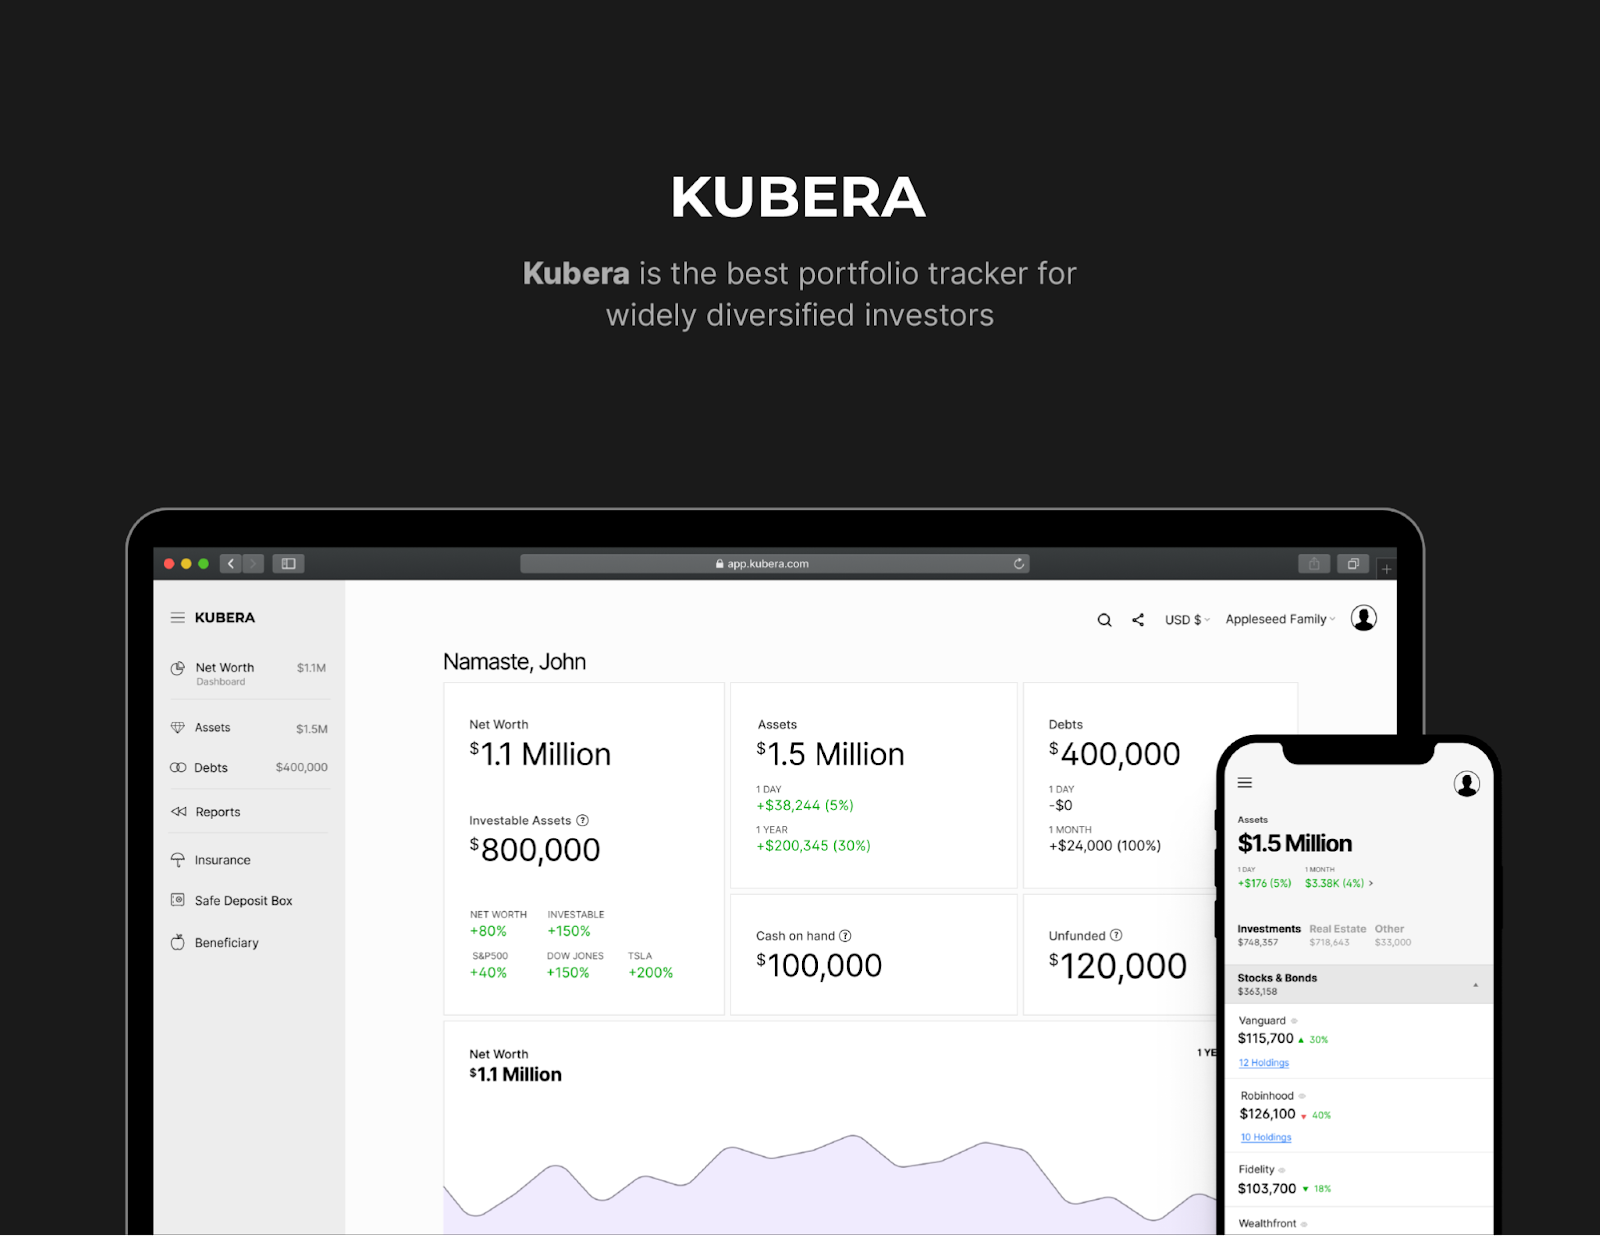
The Kubera portfolio tracker holds both benchmarks in one place, on the same balance sheet that tracks everything else. Each asset's Returns tab carries the cash-flow history, the IRR, and the same-period return of the S&P 500 or any ticker you choose. Your Club sits on the dashboard, under Investable Assets and Cash on Hand and in the home's details, and updates itself as net worth moves. Billboard is under the profile picture. Kubera connects thousands of banks, brokerages and exchanges through multiple aggregators, tracks private funds with committed capital, calls, distributions and IRR, and runs multi-currency through every layer, so the peer comparison covers the whole balance sheet, not the part a single brokerage can see.
None of it is investment advice. Kubera puts the true number beside the right comparison; the decision stays yours. The 14-day trial is fully loaded, so you can see your own numbers against your club before choosing a plan.
Frequently Asked Questions
How do I compare my portfolio to other investors?
Use a peer benchmark rather than an index. Kubera's Your Club assigns you to an anonymous group of customers in a similar net worth range and shows your net worth growth, investable-asset share, cash on hand and primary-residence share next to the group's medians. Medians appear only when a club has 500 or more members, and individual data is never shared.
What is the best benchmark for a personal portfolio?
It depends on the question. For a single position, the index it was meant to beat, compared on IRR using your own deposit and withdrawal dates. For the whole balance sheet, households with a similar net worth, compared on structural ratios such as invested share and cash held.
Why is IRR better than simple return for benchmarking?
Simple return ignores when money went in and out. IRR accounts for every cash flow and its date, and it lets you give the index the same cash flows, so both sides are measured the same way. Two positions with the same 30% gain can have IRRs of 4% and 25% a year.
Can I benchmark against something other than the S&P 500?
Yes. In Kubera the comparison ticker on each asset's Returns tab can be any index or security, such as a total-market fund, a single stock or Bitcoin, calculated for the same period as your investment.
Is Your Club anonymous?
Yes. Medians are only shown when a club has at least 500 members, only aggregated medians are displayed, and no individual's data is shared. You cannot see who is in your club, and nobody can see you.
What does Kubera's Billboard show?
The stocks, funds, cryptocurrencies, banks, brokerages and exchanges most held by paying US customers, ranked by how many customers hold each one and updated monthly. It is a popularity count, not a performance ranking, and not investment advice.
Should I rebalance to match my club's medians?
No. A median describes a group; it is not a target. Treat an outlier as a prompt to ask why your number is different and whether the reason still holds. Most well-run balance sheets are outliers on something, on purpose.
The Principle Worth Keeping
Benchmark each investment against the index on your own dates, and benchmark your balance sheet against people like you. The first tells you which decisions you would make again. The second tells you which habits you never noticed making. Neither tells you what to do; both make sure that whatever you do next, you do it knowing where you stand.
This article is general information, not investment advice. Benchmarks describe the past and the group; your decisions depend on your own circumstances.


